Measurement
S/N map tool
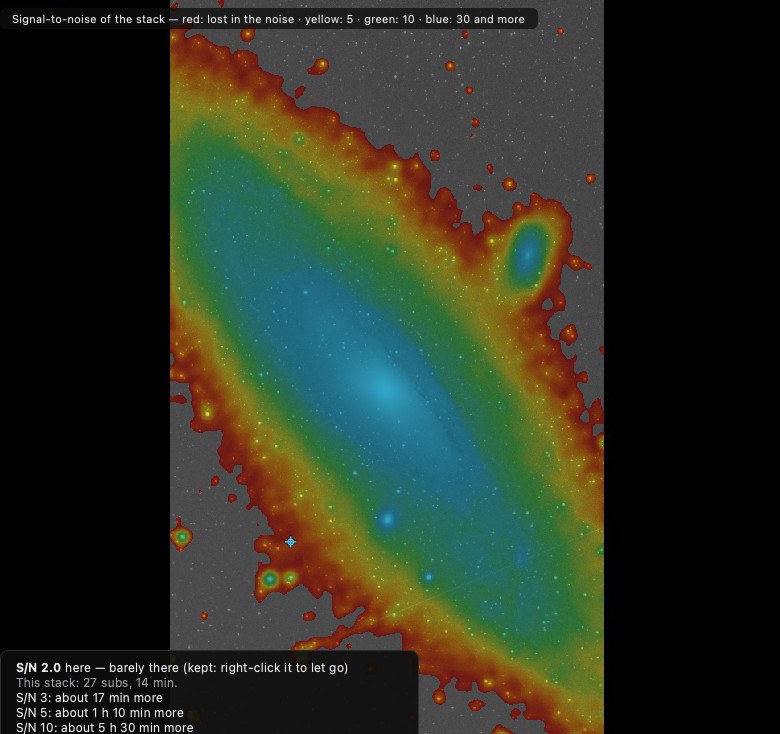
Shows the signal-to-noise ratio of the stack in false colours and, for the region under the pointer, the extra exposure time needed to reach 3, 5 and 10.
How to use it
- Open the linear stack and click S/N map.
- Point at a faint part of the object: the readout gives its signal-to-noise ratio and the extra exposure needed to reach 3, 5 and 10.
- Right-click keeps the place, marked with a circle; right-click again releases it.
Settings
- Colours
- Grey: below 1. Red: 1. Orange: 3. Yellow: 5. Green: 10. Blue: 30 and more.
When to use it
On a linear stack, to decide whether a faint region needs more exposure.
Image
Measures the linear stack; nothing is changed.
Example